NPS & TripAdvisor ratings
Research at Cendyn
Using the Net Promoter Score (NPS) to improve your TripAdvisor Rating
Businesses whose clientele utilize travel websites such as TripAdvisor to make purchasing decisions, such as hotels, are engaged in a battle for rating supremacy. From the hotelier perspective, the benefits of a higher rating on TripAdvisor seem obvious, but there is some empirical work testing hypothesized benefits including increased market awareness, hotel occupancy, and Average Daily Rate (ADR). Making the assumption that a higher rating on TripAdvisor would be beneficial to a hotel, we started to think more about how Guestfolio could help hotels increase their ratings.
Net Promoter Score (NPS) and TripAdvisor Rating (TAR):
We have previously written about NPS, which measures the likelihood a guest will recommend a product or service to someone they care about e.g. a family member or friend, as the key guest focused performance indicator for hotels. Claiming a logical connection between a guest’s level of advocacy for a hotel and a platform for accommodation related opinion sharing, we decided to examine the relationship between the two.
Our study examined NPS and TAR from January 2016 to August 2016. A sample of 73 hotels resulted in approximately 27600 observations. For the analysis, NPS was measured using the standard 11-point 0-10 NPS scale where respondents are subsequently categorised as detractors, neutrals, or promoters to calculate the net proportion of promoters, TAR was measured using TripAdvisor’s rating out of 100 – which actually ranges from 20 to 100 – and the simple average rating per hotel was used.
In the first test, the strength and direction of the association between NPS and TAR were measured using the Pearson Correlation, where 1 is a perfect positive correlation, -1 is a perfect negative correlation, and 0 indicates no linear relationship. The correlation between NPS and TAR was 0.913, indicating a very h4 positive correlation. In other words, NPS and TAR tend to ‘move’ very similarly.
The second test expanded on the Pearson Correlation to calculate the Coefficient of Determination (COD). This coefficient indicates the percentage variation in TAR explained by NPS. The COD was 0.834, in other words, 83.4% of the variance of TripAdvisor Ratings was ‘explained by’ the Net Promoter Score.
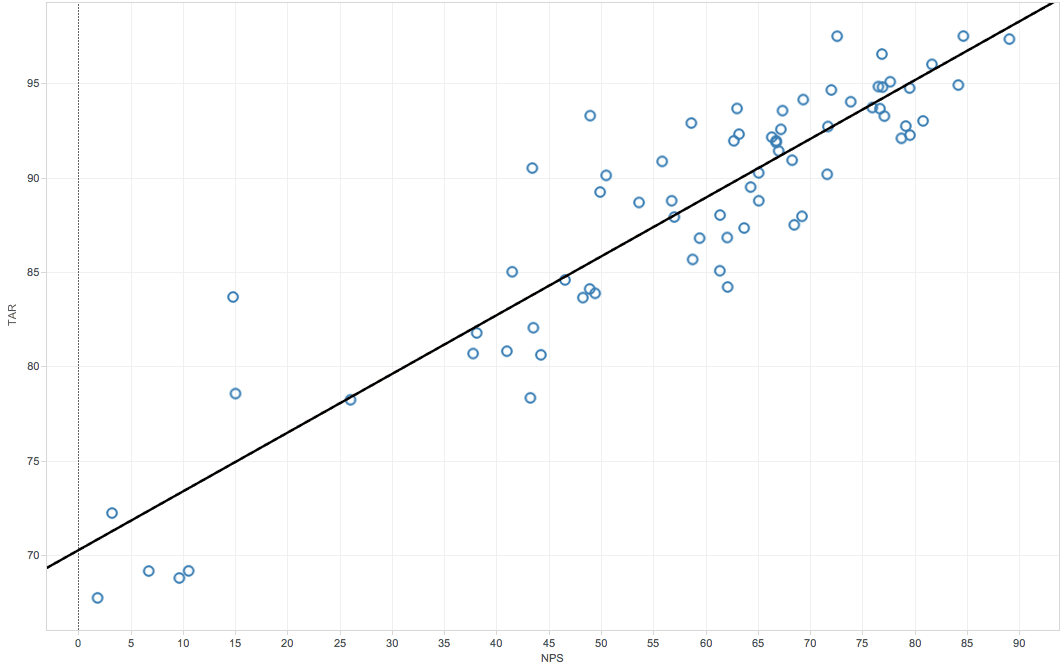
A final analysis utilized linear regression to determine what change in TAR can be expected given a certain change in NPS. The results indicated that a 10 point increase in a Hotel’s NPS will lead to a slightly greater than 3 point increase in TAR. This relationship is discussed below and clearly visualized by the scatterplot with regression line in figure 1 below.
Figure 1:
Scatter Plot of the Linear Relationship Between NPS and TAR
Discussion:
Firstly, while our examinations clearly show a very h4 association between NPS and TAR, we remind readers this does not mean NPS causes TAR. Rather, we logically hypothesize the many actions hoteliers take to create guest experiences largely determines both scores.
Second, the value for hoteliers in understanding the relationship between NPS and TAR is that the Net Promoter Score provides the insight on how to improve. In other words, ensuring your Net Promoter Score is 1) tracked and 2) part of your decision-making process, will enable you to make guest experience improvements that translate into higher TripAdvisor Ratings.
Third, increases in TAR are profound. Based on our sample of hotels, the market is tight; an increase of 1 Trip Advisor Rating point will increase a hotel’s rating position on TripAdvisor by approximately 5 percentiles. From the NPS perspective, this requires an increase of around 3 in the Net Promoter Score. In other words, seemingly incremental changes in your Net Promoter Score are likely to translate into large rating position benefits on TripAdvisor.