

Total revenue analysis driven by Power BI
Compose data into intelligent insights
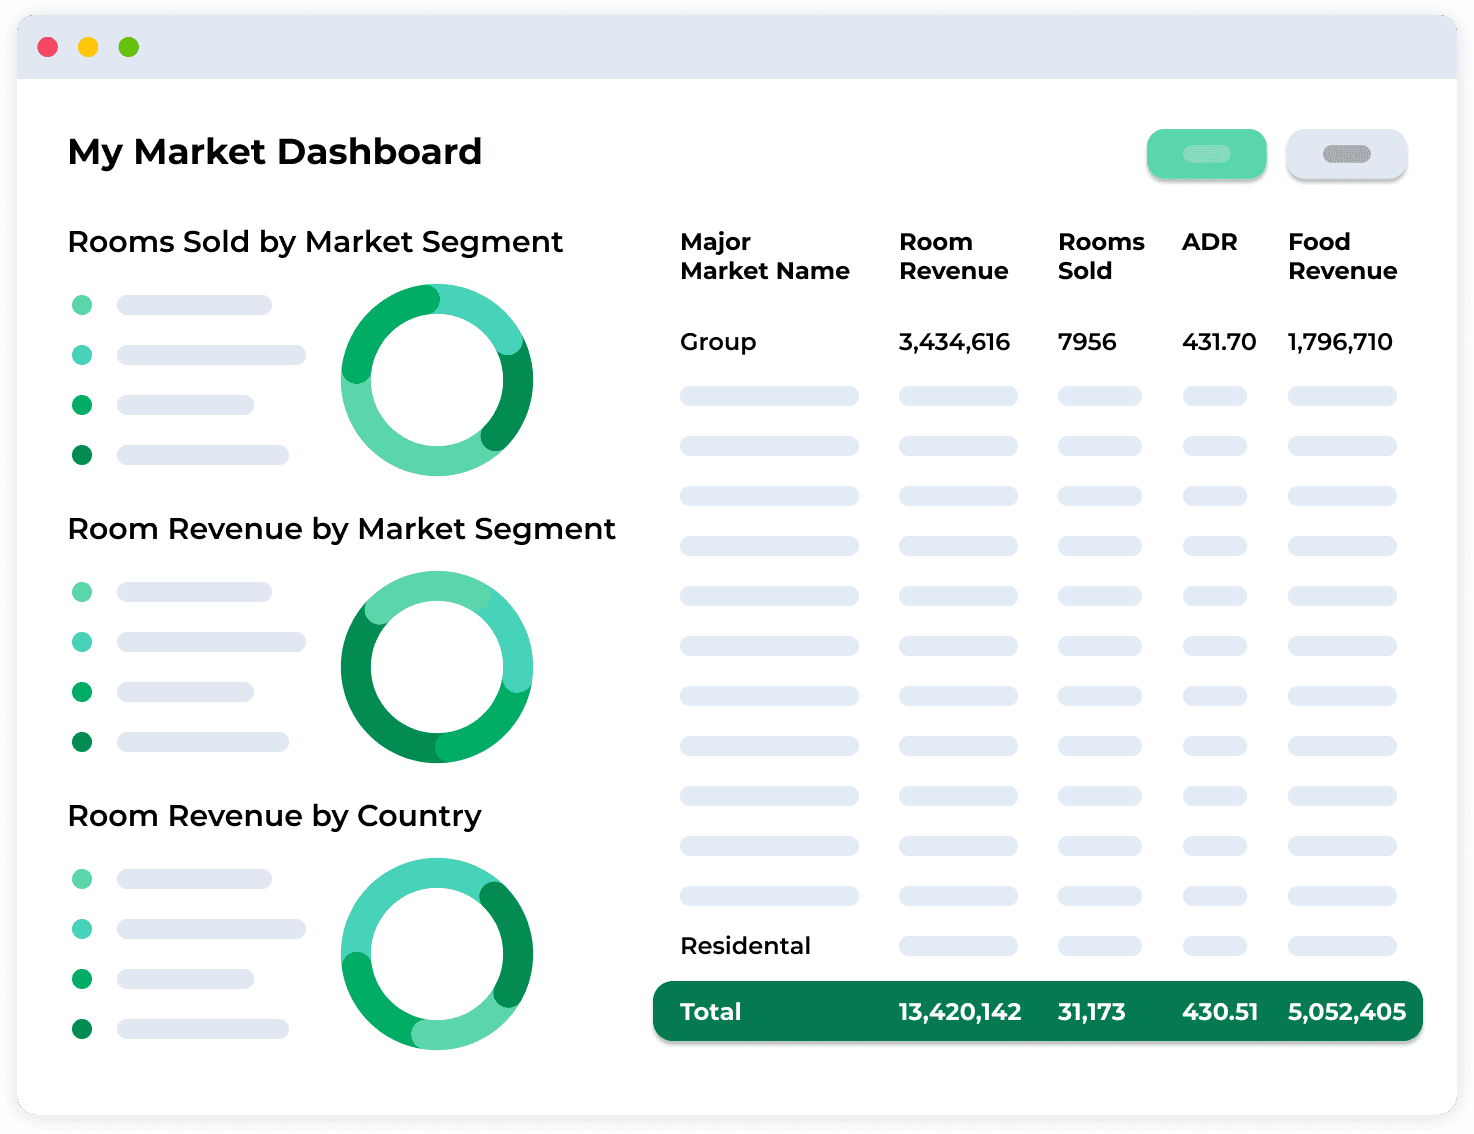
Spend more time on analysis and strategy rather than acquiring data. With 55 standard out-of-the-box reports and Revintel’s BI solution, Compose, seamlessly create your own custom brand-matched interactive visualizations in a variety of formats.
Utilizing Revintel’s robust library of reports we have been able to create very detailed analytics which has allowed us to gain invaluable insight into demand trends in our market. This information has led to smarter marketing spend, greater reservation conversion and increased revenue capture.
Team collaboration
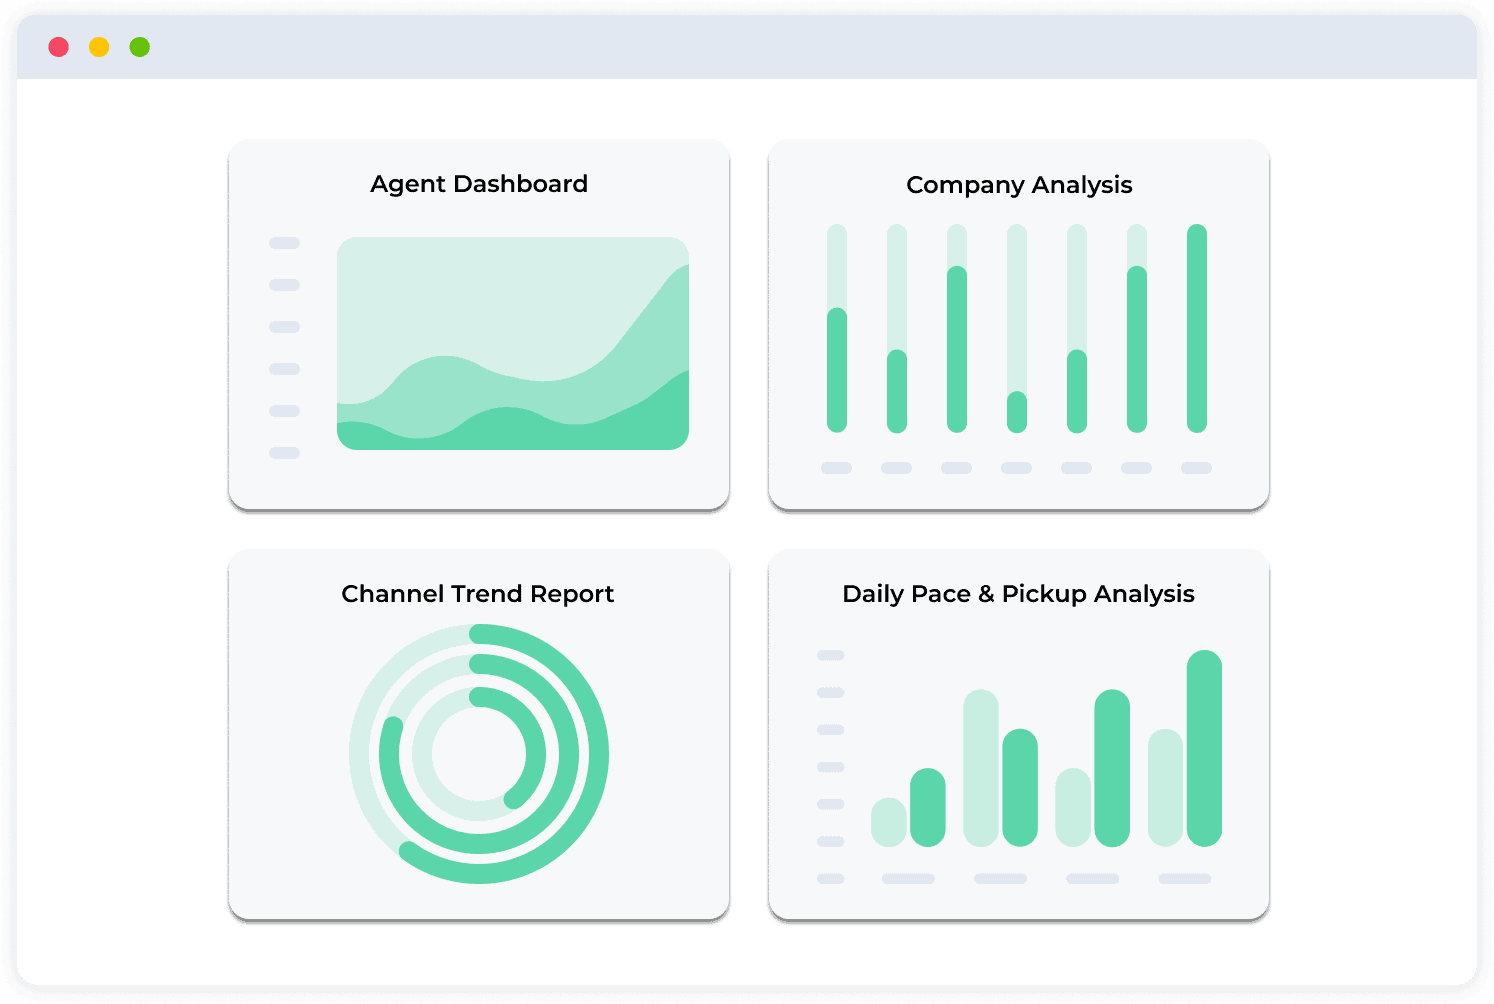
The easy-to-use interface promotes cross-team collaboration. Marketing can view real-time campaign performance; sales can monitor negotiated accounts by tracking performance at the rate code level; and, of course, revenue managers can view the full picture of ancillary and room revenue at the agency, corporate and portfolio level.
Our resort’s marketing team can now see exactly where guests are coming from, what their onsite spending is like, etc. This has enabled the marketing team to enhance their marketing efforts and create more personalized communications to guests.
Business intelligence made simple
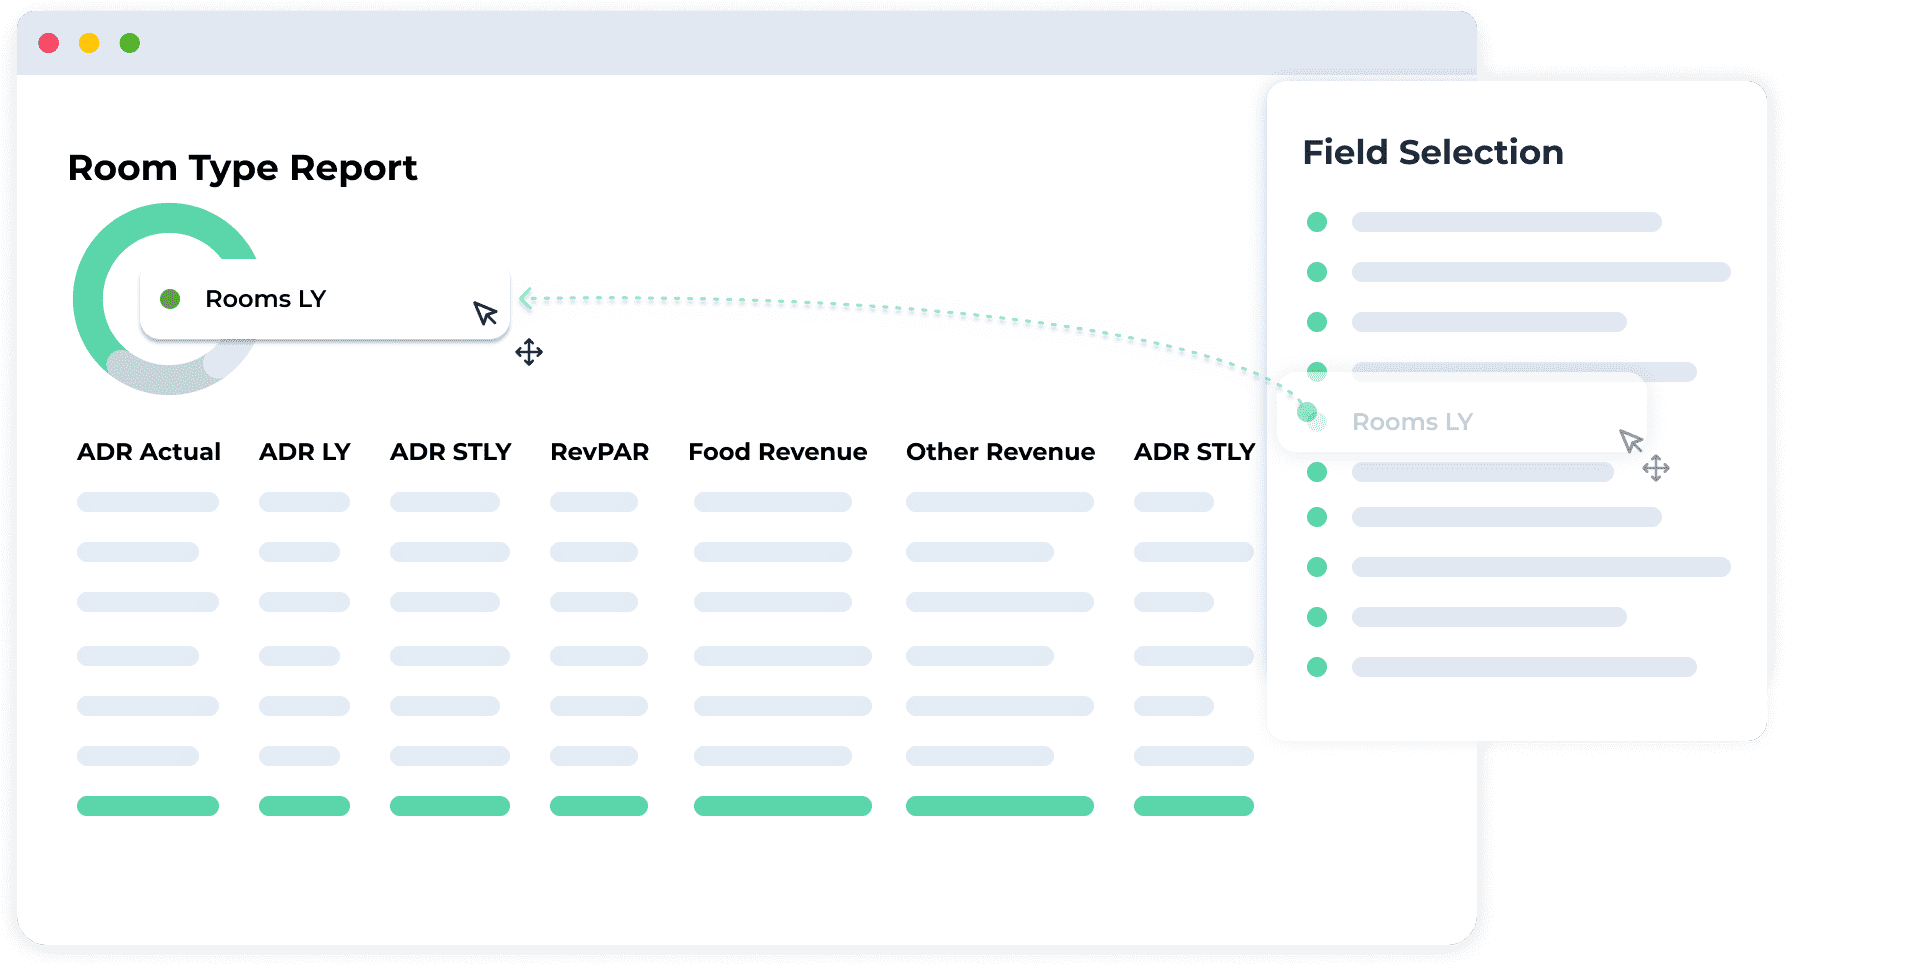
The easy drag & drop functionality for reports makes it simple for anyone on your team to build and analyze custom dashboards and reports in just minutes – no complex spreadsheets or programming required.
Featured stories


Best practices

Revenue management for hoteliers: Discover why CRS & RMS integration is the key to success in 2023

Rethink your casino revenue strategy for a total revenue world

Rethinking the hotel tech stack for optimal revenue optimization
Let's get started!
Tap into your disparate datasets by transforming them into actionable business intelligence so you can make quicker decisions that impact change.